Media2URL
Track media delivery and workspace usage

See what your shared files are actually doing

You send a file, proceed to other tasks, and later ask yourself if the recipient ever clicked on your link. This question becomes more difficult to answer when you share multiple files simultaneously, or when you begin to use up a lot of bandwidth by sending a large video file.

The Media2URL Insights brings together all the useful numbers. You can see views of active share links, the number of downloads over time, how much bandwidth has been used, and how much space is being used by your workspace; however, you will not have to create a complete visitor tracking system just to use this feature.

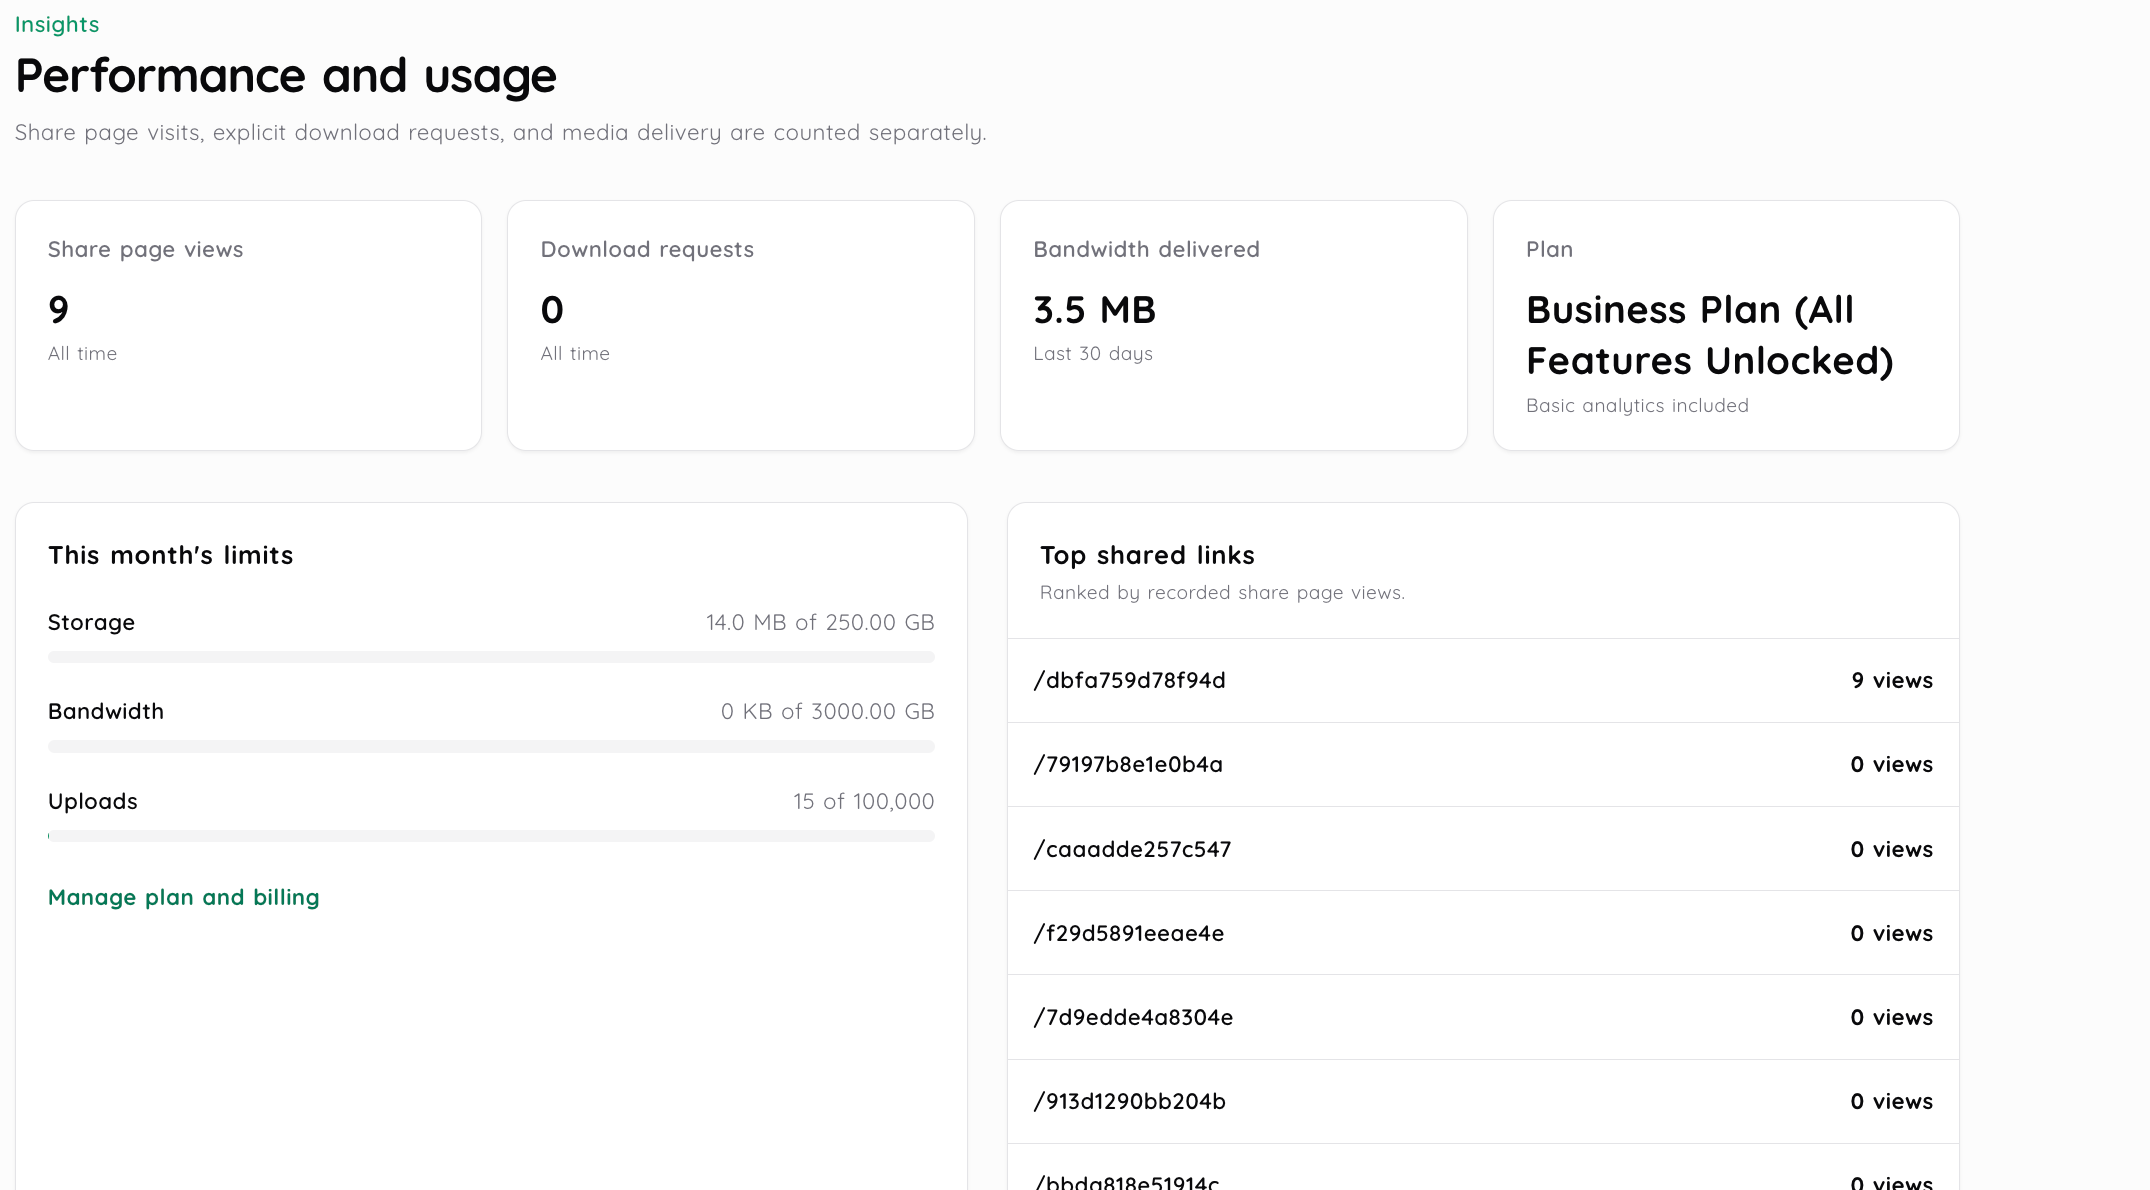
Media2URL Insights dashboard showing share page views, download requests, bandwidth delivered, plan, monthly usage limits and Top Shared Links
Review link activity and workspace usage together in the Insights dashboard.
Core metrics

Start with the question you are trying to answer

You'll be able to interpret those scores much more clearly once you quit viewing each of them as part of a single performance measure.

If you need to find out if there was activity on a share page, use "views." If you want to know if files were downloaded, use "downloads." If your main focus is on how much data has been transferred, then "bandwidth" will be most relevant.

Workspace use has its differences as well. The meters for storage and plans provide data on the overall account, rather than if an end-user received the file, appreciated what was sent, or understood the content.

MetricWhat it shows
Share page viewsThe accumulated view count recorded for an active share link.
30 day downloadsSupported download events recorded over the rolling 30 day period.
30 day bandwidthFile data delivered over the rolling 30 day period.
Storage usageHow much workspace storage is currently being used.
Monthly bandwidth quotaCurrent bandwidth usage compared with the plan limit
Monthly upload quotaUploads counted against the available monthly limit
Top Shared LinksIn addition to being able to see how much of your current bandwidth is used, as well as seeing what percentage of that usage has been consumed from your available monthly download/upload limits, you can also view up to 10 of your shared links organized by most viewed first.

A simple picture may receive many hits while barely affecting the data usage. A complicated video will do the exact opposite within a short amount of time. You will understand the data better when you view both at once rather than expecting either measurement to tell you everything.

Asset-level analytics

Open a file's Analytics tab for link-level activity

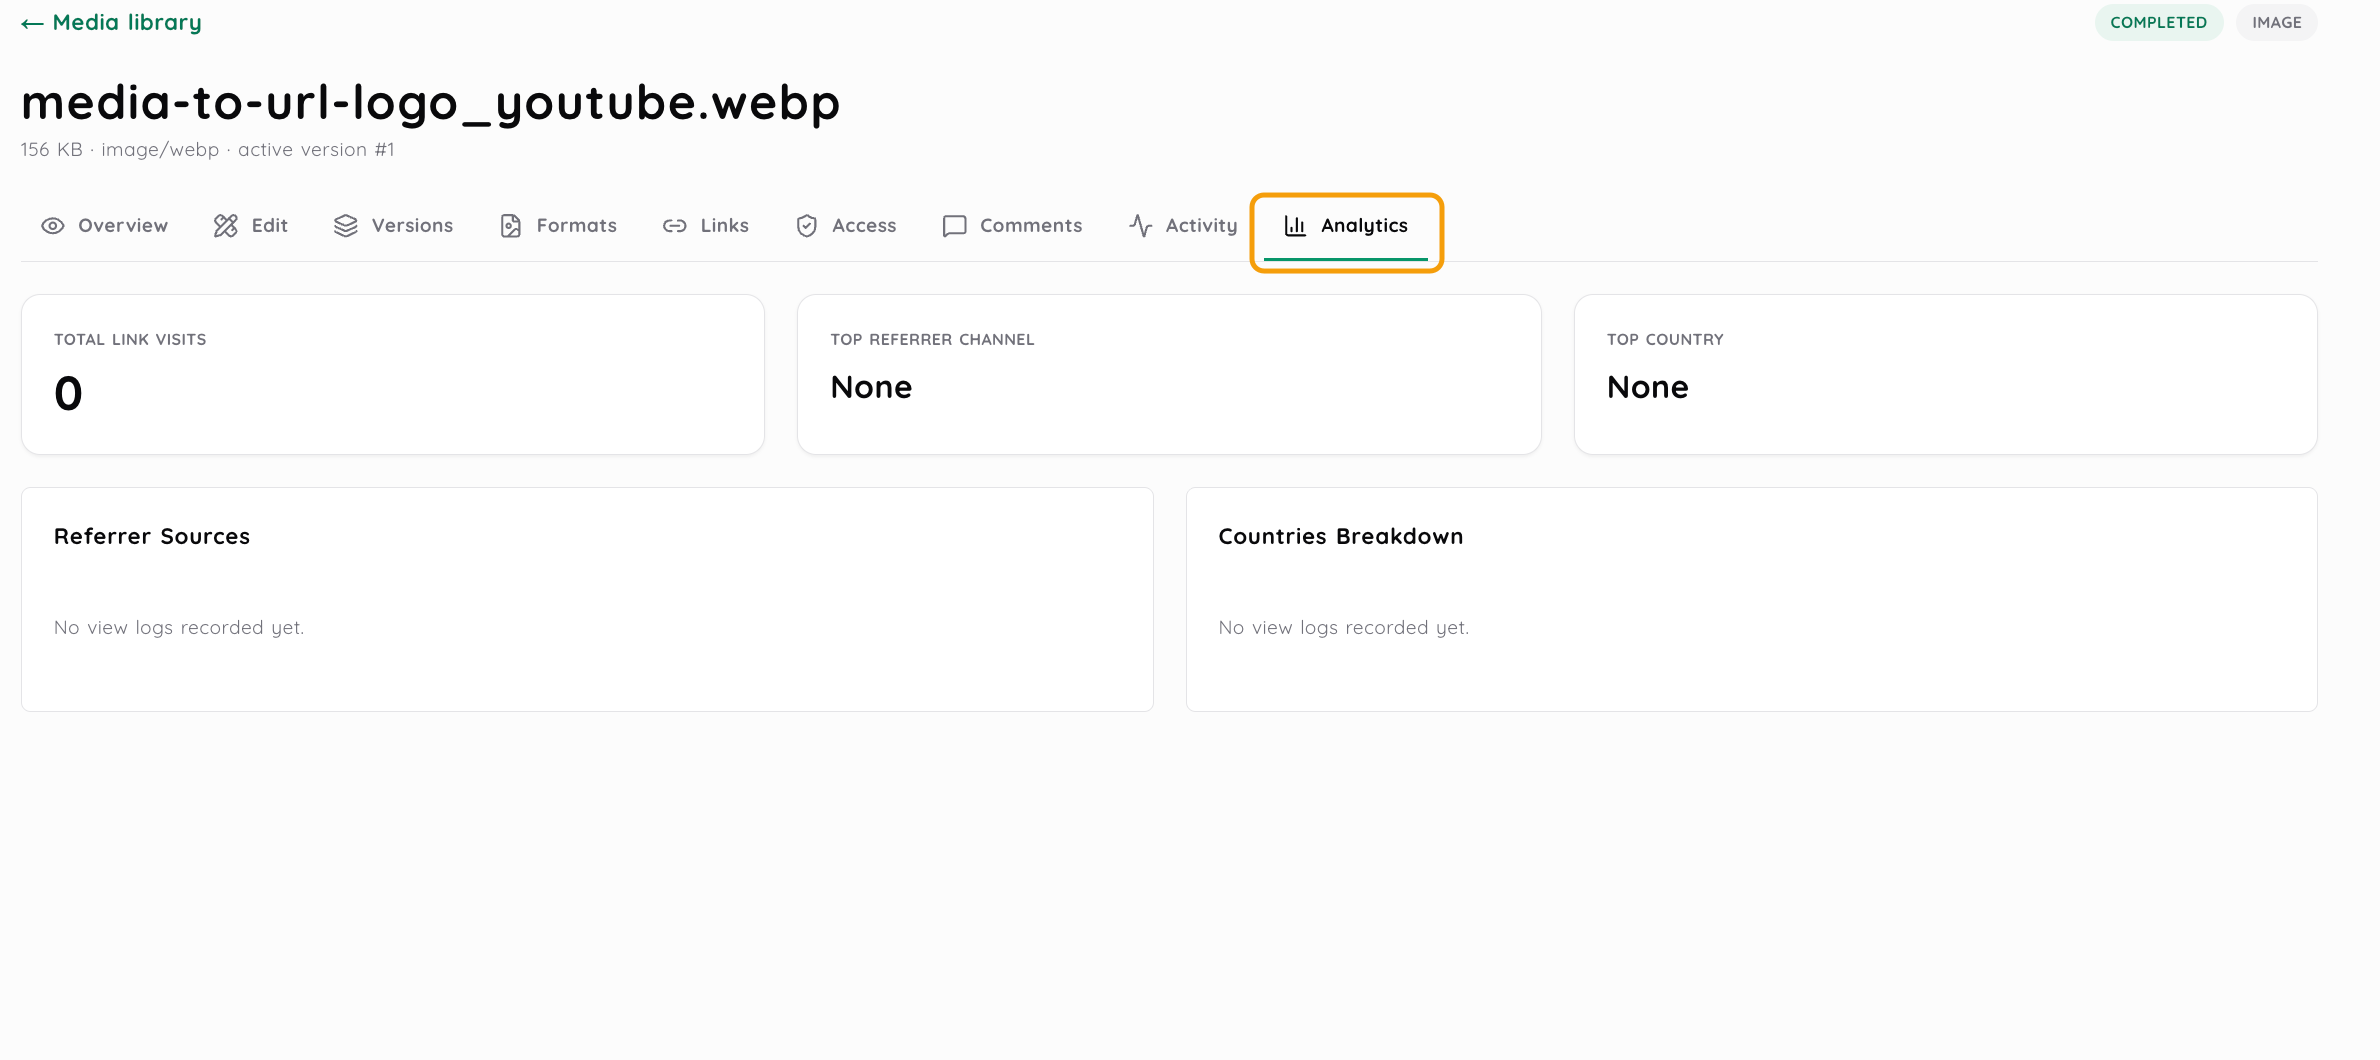
Every single media asset will have an "Analytics" tab where users can see total visits, referrers, and/or countries if they have viewed records. The image shown here represents what an asset looks like without having ever had any of these records recorded.

Analytics tab for media-to-url-logo_youtube.webp showing zero link visits and no referrer or country logs yet; an amber outline marks the selected tab
The selected Analytics tab is outlined; this asset currently has no recorded view logs.

Views and downloads tell you different things

If you mail a client a PDF and they look at it two times over the course of the week, and then download it one time, the number of views and downloads won't equal each other because these numbers are counting two separate events. It is normal for this to occur.

Views are beneficial for knowing if the share page is being viewed. However, downloads take it a notch higher than views as they represent some form of download support from the site. On the other hand, neither views nor downloads will inform you as to what occurs with the file once it arrives on the end-user's machine.

The dashboard can't determine if someone read all the pages in the PDF file or closed the file after opening it. The dashboard tracks the actions taken related to the link but not the amount of time people spent looking at the link.

Bandwidth starts to make sense once file size enters the picture

A view is simply a tally; whereas, bandwidth is the amount of information sent. Therefore, when you have a big video viewed multiple times, this will consume far greater quantities of bandwidth than what hundreds of views on a tiny image would. Thus, just because your bandwidth is increasing doesn't necessarily mean that you are experiencing an explosion in popularity.

Media2URL sums up the byte size of all recordings delivered within a moving 30-day window and displays that number in an easily understood unit (KB, MB, GB). This is helpful if your usage goes up and you don't think your view counts are high enough to account for the increased usage. Large files will increase your bandwidth total very quickly.

Top Shared Links is a quick way to see which share pages are getting opened

When there are numerous active assets within your workspace, reviewing each asset individually can become monotonous. The "Top Shared Links" feature displays up to ten links based on the number of times they have been viewed. From this display you can identify which share pages receive the highest number of views, and therefore may require further review of the associated asset if there is a problem with the file itself or the files settings.

The ranking of files in terms of popularity is determined solely by the number of times each file has been viewed. This ranking does not include any other factors such as downloads, bandwidth used, etc. This distinction can be very important since a file that ranks high on the list does not necessarily consume the largest amount of bandwidth.

The same dashboard also keeps an eye on the workspace

Insights is not restricted to what people are doing with single links. The Storage Usage area of the site will show you exactly how big your current library is. Your Monthly Bandwidth Meter will give you an indication of the amount of data delivered under your service plan, and the Upload Meter will allow you to see the total amount of uploads made during that time.

The previous data will help me determine what I should do next when I need to make a large upload, or if I want to distribute media files to many more people than I have previously. Checking the status of the workspace prior to making those decisions will provide me with a clearer understanding of how the account stands.

Storage is evaluated based on its status today (i.e. what exists in the workspace right now), whereas bandwidth and upload usage reflect activity during the current billing cycle.

Insights does not try to identify the person behind every visit

The dashboard continues to report on overall activity for each file. At this time, Media2URL does not provide you with referrer report, visitor country, or browser breakdown inside of Insights. Therefore, you will not be able to determine what country generated the highest number of views, what location your visitors were located in, or what browser your visitors were using.

Insights is a more limited feature than a complete web site analytics service, however, the data presented is focused on file delivery and account usage. If your inquiry is “Was this URL accessed?”, then Insights can assist you. If your inquiry is “Who accessed the page and how did he/she find the page?”, the present dashboard will not be capable of providing such detailed information.


Analytics stay connected to the link

The activity that occurred prior to deletion of a link can be tracked through the links that remain active. Thus, if you delete a link (or clear your links) the history of engagements with the URL is lost. This should be taken into consideration prior to deletion of any link if the prior activity is still valuable.

Therefore, the analytics are tied to the existence of the link, and are not a separate, permanent reporting system.

Practical interpretation

Reading a real dashboard without overthinking it

Client review links

A single client review link may have multiple visits (views), however only a single download. It is normal. The person who received the link can go back to the same share page many times, and will only be able to obtain a single copy.

Large media files

A video has a small number of views however, its use of data is increasing rapidly. The size of the file would be able to account for this without a significant rise in traffic.

High-view lightweight assets

Another photo is located at the very top of "Top Shared Links" and has had little effect on the amount of bandwidth used. This is completely normal since so many people are able to access a lightweight image file with virtually no data transfer.

The helpful practice of asking what each number represents before interpreting its meaning.

Operational bounds

A few limits to keep in mind

  • Monthly Bandwidth & Upload Usage This is a reflection of how much data you have uploaded and downloaded during your current billing cycle. Storage This is a reflection of how much of your total workspace storage is being used at any point in time.
  • The referrers, countries, and browsers reports are not currently included on the insights dashboard.
  • An asset deletion or the removal of all of its links will cause a reset on the history of tracking user engagement with that URL.
  • Before making a big upload or having a lot of people access your shared content, check your active quota meters. Your quota limits will vary based upon which plan you currently have.
Questions about Insights

Frequently asked questions

Insights displays total activity, not the identification of each visitor. Total share page views, total downloaded files and total bandwidth delivered are available for viewing. Referral, country and browser information is not available at this time.

The present day characteristics of the software have not established a set time for updates. You should rely on what is displayed in the dashboard as being the most recent data collected within the workspace, as opposed to assuming there will be a particular update cycle.

The Insights page currently displays both the rolling 30-day bandwidth total and a ranking of Top Shared Links based on views. Since there isn't a separate ranking of individual files by bandwidth displayed on the Insights page, the Top Shared Links table cannot be interpreted as such.

Insights displays the user's current month bandwidth consumption against their allowed amount, which is based on the user's selected plan. There is no information in the product features about what occurs once the user exceeds their allocated bandwidth for the month. To find out how the user's current plan handles bandwidth limitations, refer to the user's active plan details and/or workspace settings.

Activity is recorded on the share page by a view. A supported download event is recorded as a download. It is possible that someone will open the page but not download the file, therefore the total number of views and downloads are not expected to equal each other.

No. A files size will tell you what size of an asset that you have saved. Bandwidth measures the total amount of files (or file data) that were sent through the use of the network. A single file can add to the bandwidth consumed every time it is downloaded.

The dashboard will order the top 10 shared links based on the number of times each has been viewed. It does not include download numbers or bandwidth in this ranking.

No, there are no country or browser reporting as well as no referer reporting within the Insights dashboard. The focus of Insights remains on aggregate link activity, file delivery and workspace usage.

Next steps

Explore related management and processing tools

When you need to find or manage the asset behind a high view link.

When a large file needs another processing step before continued sharing.

When the quota meters need to be compared with current plan limits.